INTRODUCTION
This lab section is to setup the two Time of Flight (ToF) sensors. Additionally, it is required to analyze the accuracy and sensitivity of the ToF sensors.
PRELAB
Parts Required
- 1 x SparkFun RedBoard Artemis Nano
- 1 x USB cable
- 2 x 4m ToF sensor
- 1 x QWIIC Breakout board
- 2 x Qwiic connector
- 1 x Ruler or graph paper
I2C Address
It is documented that the Time of Fight (ToF) sensors use I2C channel to communicate with the Artemis board, according to the datasheet. Furthermore, the default address is 0x56.
ToF Sensors
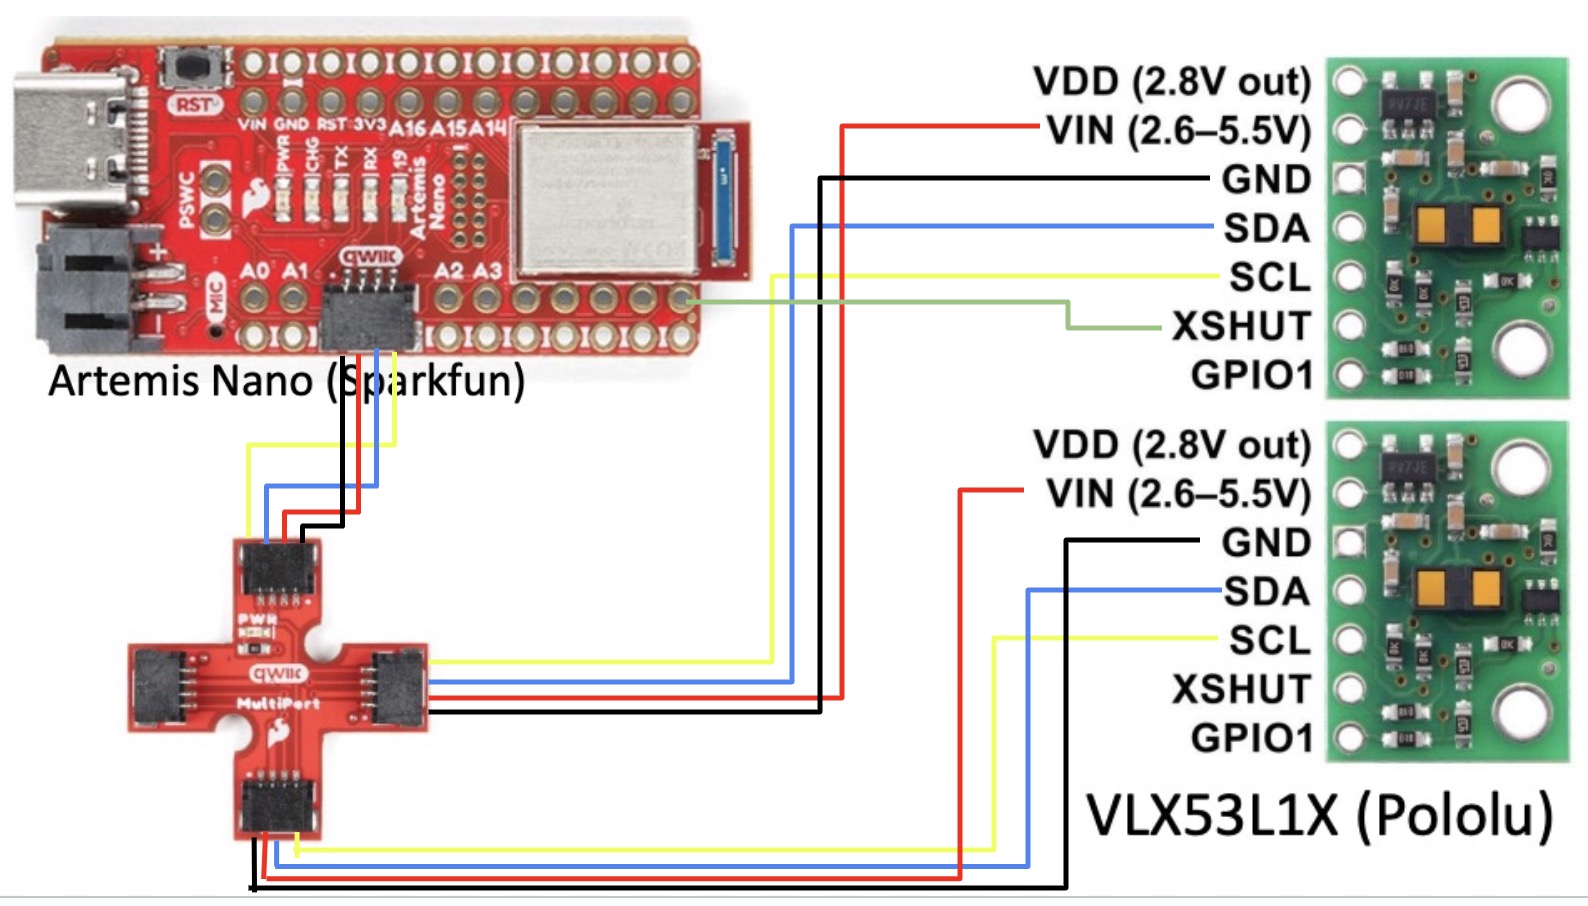
Two ToF should be implemented om the robot. Since they share the same I2C address, one of the ToF sensor should be reset to another address that is different from before. Therefore, the XSHUT pin can be connected to the Artemis, which shuts down one ToF to make the I2C address configuration. And then, this ToF can be restarted again and functioning parallelly
Placement of Sensors
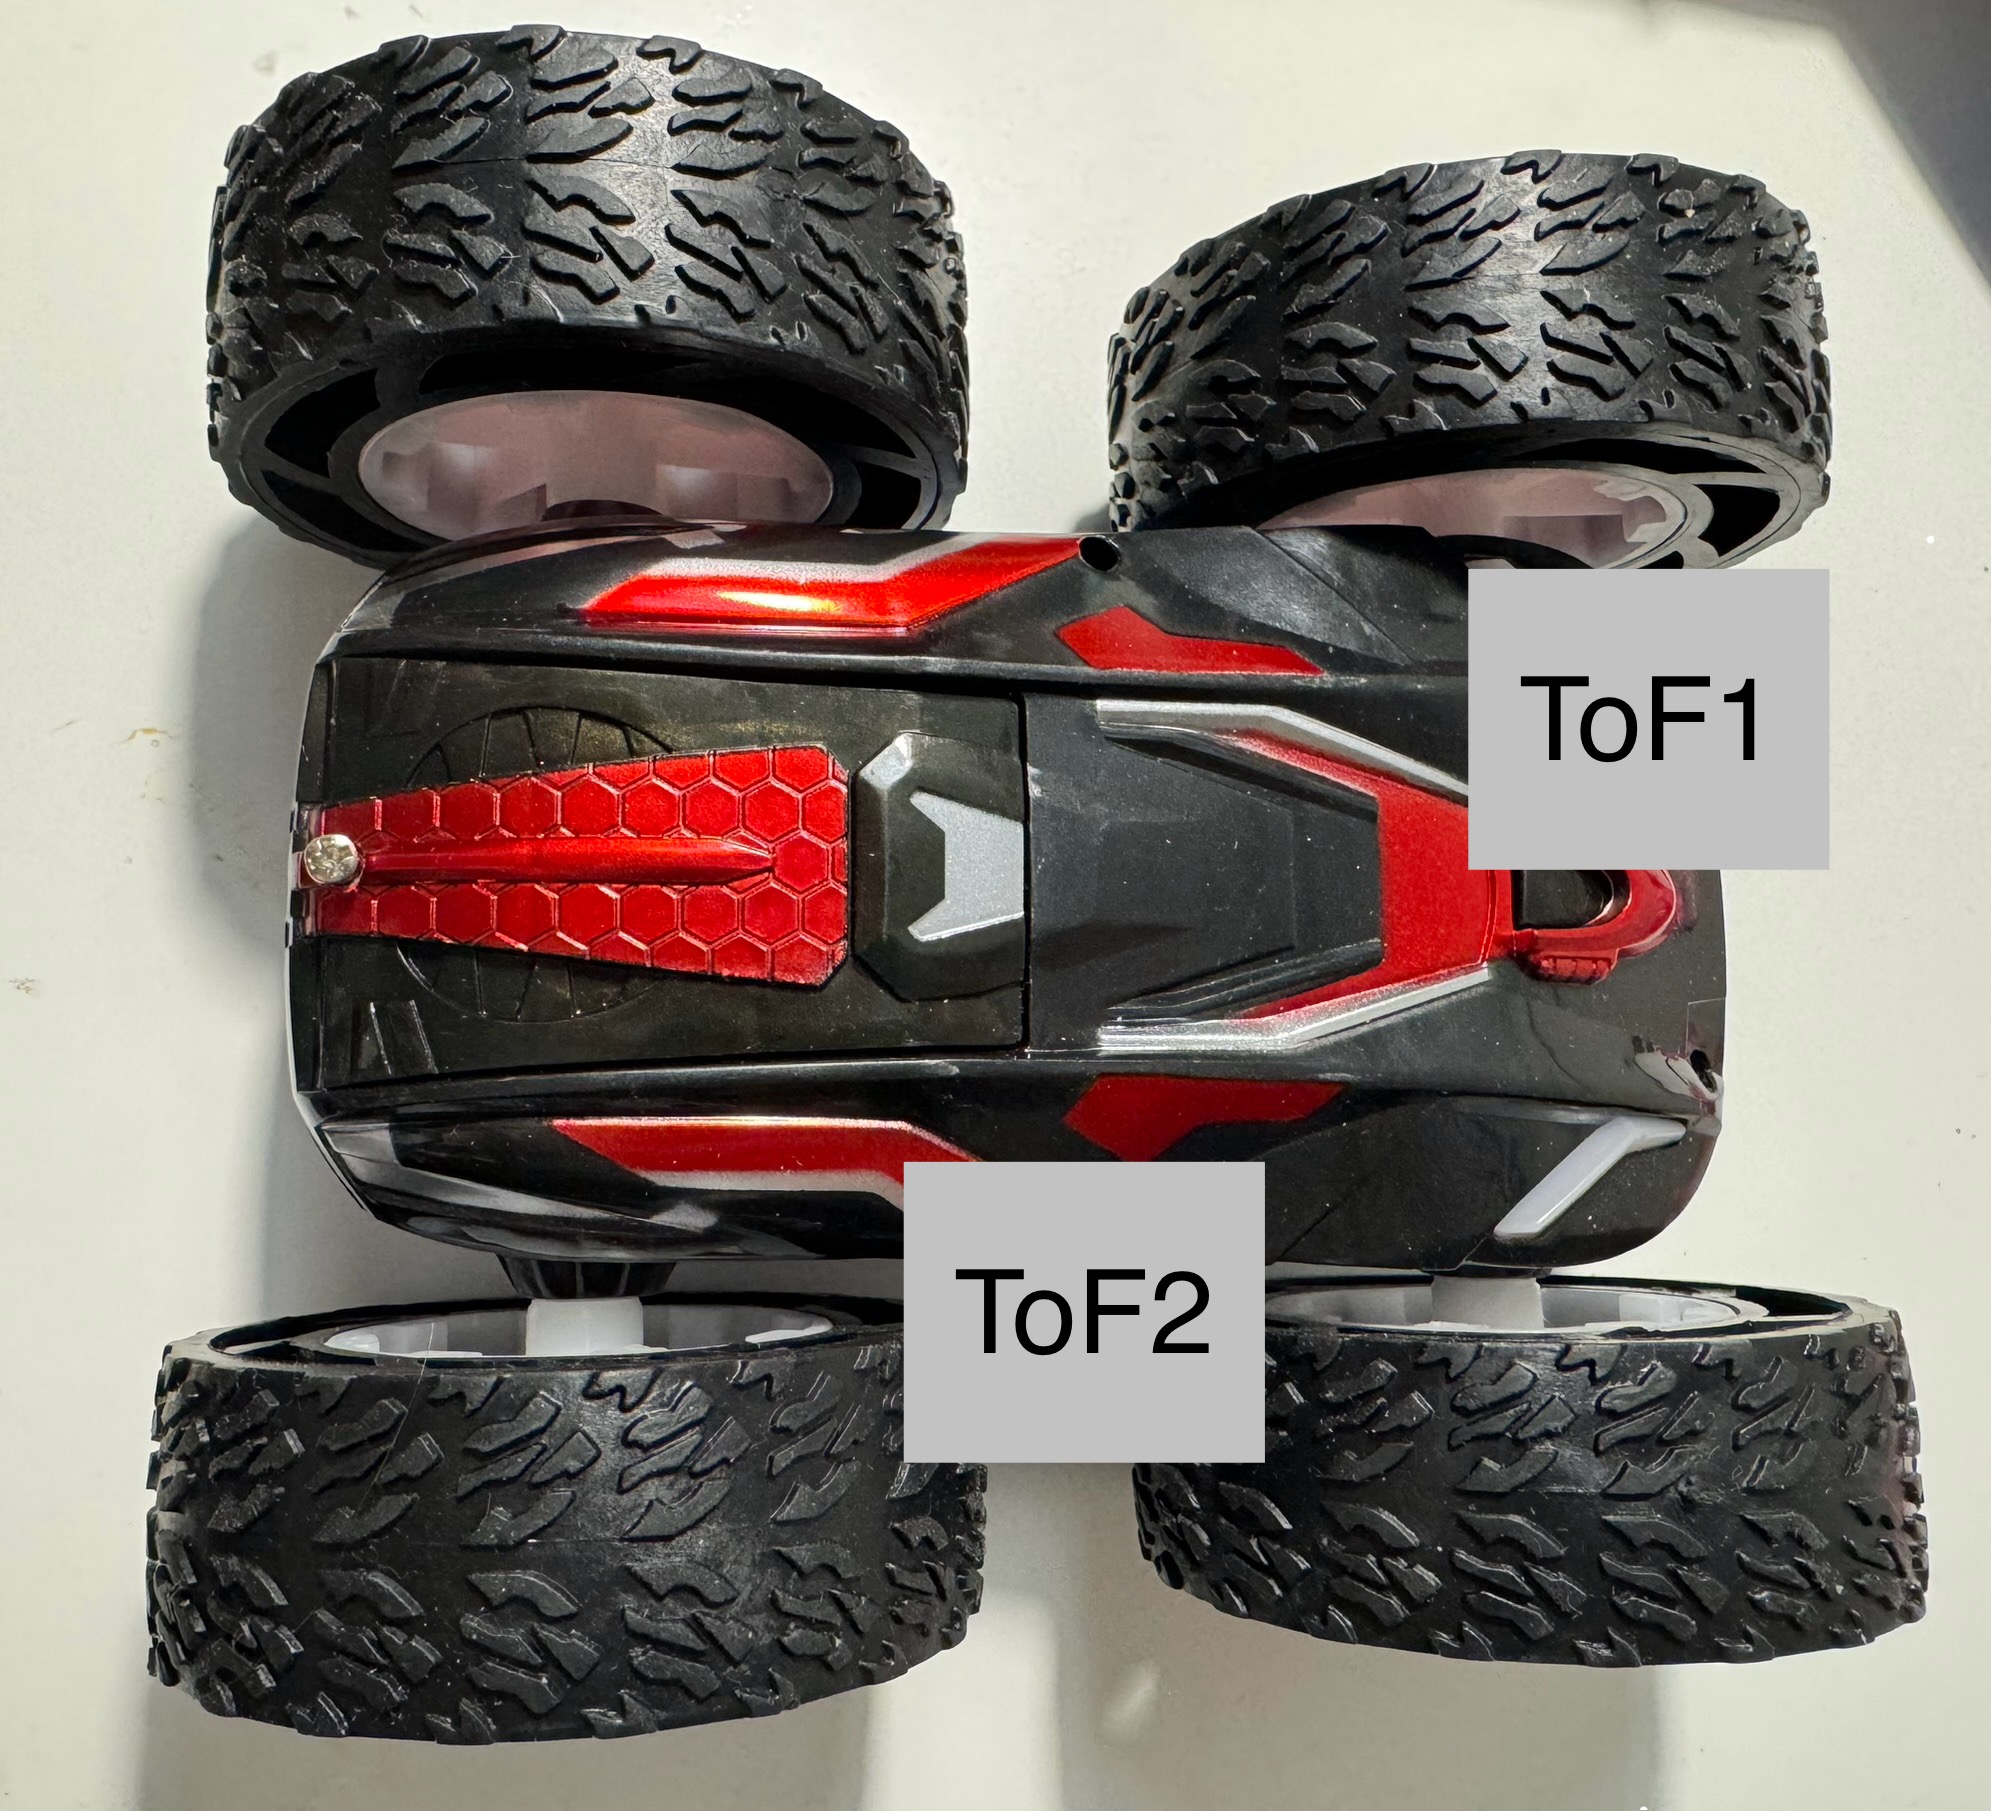
The two ToF sensors should be placed on the robot as shown below, ensuring the avoidance of obstacles.
Wiring
The following figure shows the hardware wiring of the ToF sensors to the Artemis.
LAB TASKS
i. Connection
Firstly, we cut the original wires on the battery and soldered the QWIIC connector, which can be connected to the Artemis with the JST socket.
After soldering the battery, we can connect the Artemis directly with the it, and it turned out working perfectly with the independent power supply instead of the USB-C cable linked to the laptop.
Next, the Artemis can be wired with the ToFs as shown below.
ii. I2C Device Scanning
By only connecting the Artemis with one ToF, the I2C channel address will be scanned and shown in the serial monitor terminal, which is 0x29. As I2C uses LSB of the address to indicate read/write, so the real address is 0x29 shifting 1 to the left, which is equal to 0x52.

iii. Sensor Data for Chosen Mode
The two ToF sensors is set to different chosen mode by applying .setDistanceModeShort(). Furthermore, the tape measure is used to obtain the distance.
The partial code below is implemented to extract the data from ToF sensors which is sent through the Bluetooth channel, and we can obtain various data concerning different distances by repeating those steps.
Therefore, all the data can be plot in the same diagram by applying this:
The following figure displays the theoretical and actual distance, where the blue dots represent short mode and the yellow dots represent long mode. Hence, it can be concluded that the ToF sensor is relatively accurate, but with a certain range of deviation.

iv. 2 ToF Sensor
Tp run the two ToF sensors parallelly, it is required to configure the I2C channel to different address. Hence, we need to shutdown one ToF through XSHUT pin to conduct the setup.
Furthermore, the following video shows the testing of those two ToF sensors running parallelly.
v. ToF Sensor Speed
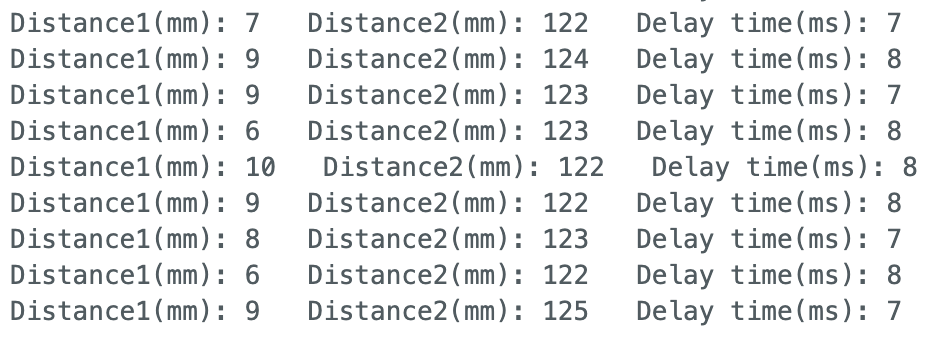
The sensor speed can be analyzed by recording the time stamps before and after reading the data, which can represent the elapsed time of the implementation of ToF.
In the figure, the delay_time is around 8 milliseconds, so the processing time is relatively fast.
vi. Time v Distance
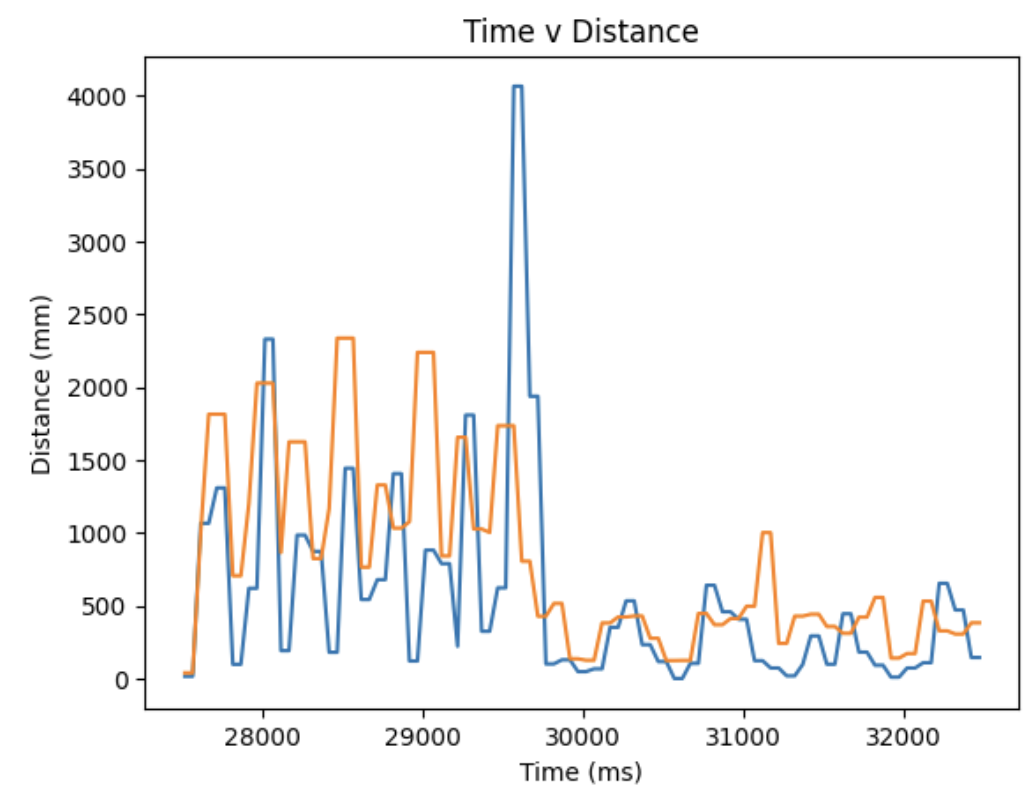
To obtain the time-vs-distance figure, we can firstly add an command GET_TOF_5s to the Artemis. This can record specific length of data during a certain period and send to the laptop through BLE channel.
The figure plot is shown below, with a data of 100 number.
vii. Discussion on infrared transmission based sensors
The ToF sensor implemented in this lab uses infrared transmission. That is to say, the distance is acquired by emitting and receiving infrared light, through the equation d=t*c/2, where c is the speed of light. Therefore, the pros are that they are immune to visible light interference and can respond rapidly. Also, IR sensors have low power consumption. However, they have some disadvantages as well, such as limited range, high cost and interference with other IR sensors. Furthermore, they might have imprecise results with different reflective color, since they operate based on the light reflection principle. This will be fully demonstrated in the following task.
viii. Sensitivity of sensors to colors and textures
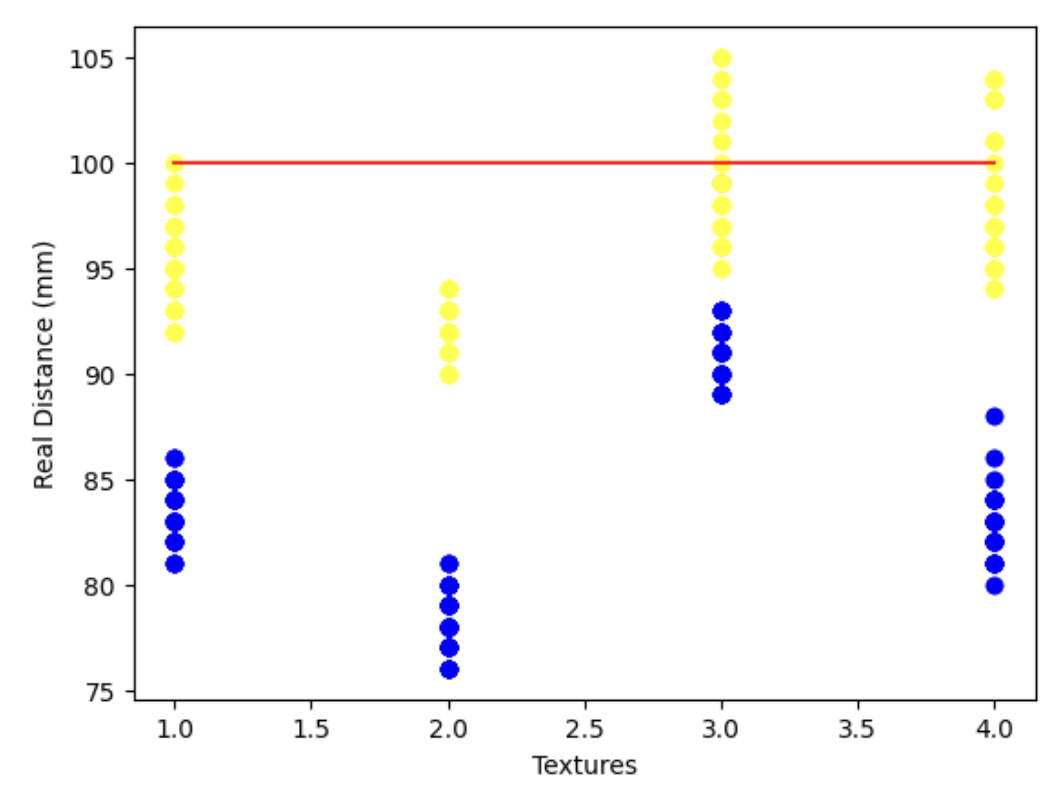
To compare difference texture, we set the distance to be measured as 100mm. The code to obtain data from the Artemis is similar as shown above in the Chosen Mode section. Accordingly, the figure can be plot based on the following code.
As it is demonstrated on the program, the textures are blue leather bag, black leather bag, white paper box and brown paper from left to right. It can be concluded that the black leather texture is the most inaccurate, because it absorb much of the light, while the white paper box is the most precise, since white color is the most reflective.
DISCUSSION
In this lab section, the ToF sensors are implemented for the detection of distance. Moreover, the analysis of the accuracy and sensitivity has help us have an in-depth understanding of the ToF.
